How to use Algostart here →
- Learn the desk's indicators. Every card is one rule: what it measures, the backtest with its controls, and the verdict above the first good number.
- Follow them day to day. The same indicators drive the dashboard, the screener and the charts: one reading, three places to watch it.
- Then let a bot trade them. Bots in Telegram, and trading bots wired to an exchange over the API. In development.
Algo
The desk's own triggers: each one measured against history so you know the edge before you trade it, and rebuilt live from public market data. Next to them are the ten best TradingView indicators and the desk's own scripts: every one of them drawn on our charts by the formula of its published source, not by a similar one. No black box.
by TT - OG team since 2017
One verdict a day, fused from validated indicators over the top 20 names screened from 100 liquid Binance USDT pairs. Regime says WHEN, breakout / relative strength say WHAT, funding / whale / flow / toxicity check entry quality. In risk-off it goes to cash and says so.
Read today's verdict →TRADFIDaily Read. The same three questions on stock, commodity and FX perpsbeta→
PLAYBOOKhow to use these triggers together for entries & exits→
BTCUSDT — candles with the desk's readings on them
BTCUSDTThe same full chart the ticker window opens: TradingView's Advanced Charts library draws candles this desk supplies from the venue's public REST, and the desk's published results lie over them. Nothing here is calculated in the browser: every number comes from the same run the indicator card prints, and every overlay the run supports is on from the start. Switch one off from the chart legend.
loading the chart and the desk's published results…
Readings from: Market Regime · Breakout Radar · Funding StressThe chart on its own page →
Indicator catalogue
Top Traders indicators
- Market Screenerscreenerliquidity, trend, risk; livePicks the coins fit to trade right now.
- Market Regimeregimemarket breadth + momentum; dailyShows the state of the market: risk-on or risk-off.
- Funding Stresspositioningfunding rate; liveShows leverage overheating and the odds of sharp liquidation-driven moves.
- Funding Ratepositioningfunding rate; dailyShows the cost of holding leveraged positions and the buyer/seller skew.
- Breakout Radarmomentum52-week high, volume, ATRFinds coins with a strong move and trend-continuation potential.
- Cross-chain Flowon-chainTVL change; 7dShows which chains capital is entering or leaving.
- Whale Accumulationon-chainlarge wallets; 24hShows what the big players are doing: adding or trimming positions.
- Relative Strengthmomentumrelative strength of the move; 30/90dFinds coins stronger than the market.
- Toxicityrisk filterprice run-up, overheating, deviation from the normShows assets where the risk of entering after a run-up is elevated.
- Attention / CT Heatattentionmentions and search queriesShows the assets and topics gaining the market's attention.
- Daily Read TradFi (β)candidatestock, commodity and FX futures; dailyReads opportunity and risk on traditional markets.
Best indicators
Each one is drawn on the desk's charts by our code, following the formula of its published TradingView source. The very one the row links to. The desk's own scripts come first.
TT Support/ResistancelevelsRSI, 2 Hull MAs, extremes; any timeframeFinds the important support and resistance zones.
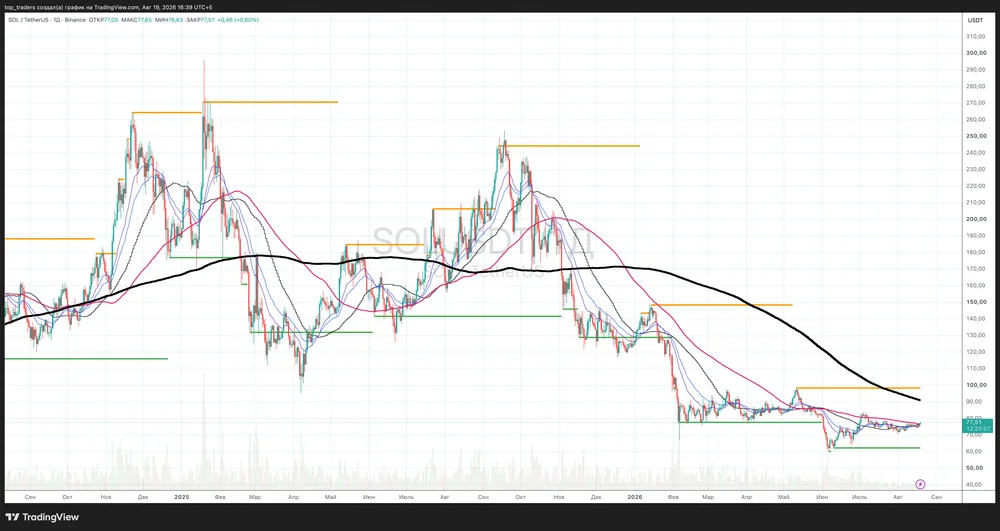
A real TradingView chart: SOL/USDT, 1D. How it works. A level appears rarely and only when three conditions meet. First: the 9-bar RSI is at an edge: below 25 for support, above 75 for resistance. Second: momentum points the same way; it is read from a pair of Hull averages, a fast one on the open and a slow one on the close. Third: the two-bar extreme has stopped updating, price stalled there instead of running on. When all three meet, the bar's low (support) or high (resistance) is stored, and the line stays HORIZONTAL until the next such meeting. The level does not trail price: it is about a price, not about where the candle is now.
When to use it. A red line above is a price where a rally has already been stopped: a place to take part of a position off, or to wait for a break. A green line below is where buyers have already held the market: a place to enter, or to put a stop under. The longer a line has stood and the more often price touched it, the more it matters. The script gives neither an entry nor an exit on its own. It is a map of prices the market keeps returning to; the decision stays with the strategy rule.
TT Smart Moneymarket structureswings, CHoCH, OB, FVG; any timeframeShows the structure of the move and the potential zones of interest.
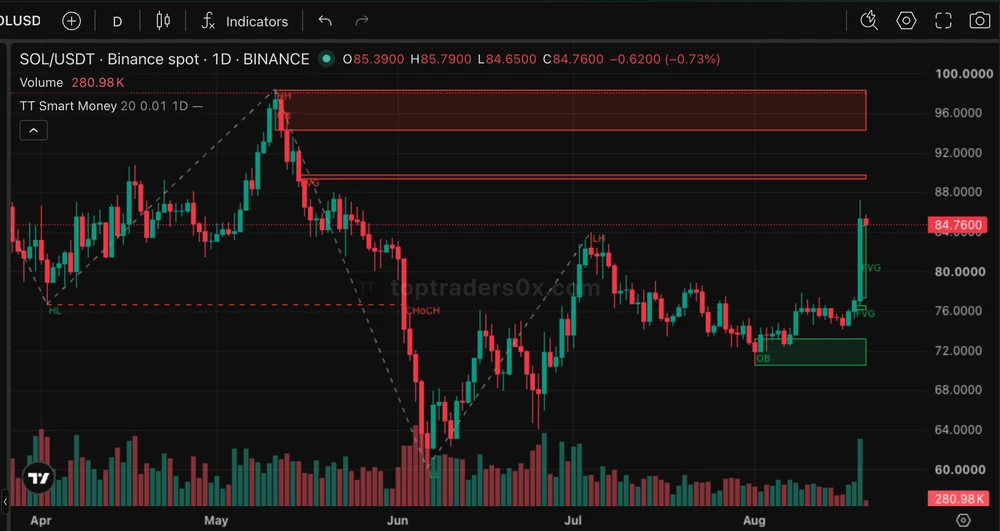
A real TradingView chart: SOL/USDT, 1D. How it works. The script computes seven things and draws them over the candles, and every mark is labelled: HH/LH/HL/LL on turns, BOS/CHoCH on structure, OB on a demand zone, FVG on a gap, LIQ on a pile of orders. A swing is a bar higher (or lower) than the bars on each side; how many is the swing length: 20 by default: the library's 50 is an intraday number, and on dailies a swing would confirm 50 days late. The chain of swings makes the zigzag. A break of structure is a close past the previous swing with the trend, a change of character is a close past the swing against it; both are labelled on the chart. A demand zone (order block) is the candle the structure-breaking move started from: the box holds until price is driven straight through it. A fair value gap is the window between the high two candles back and the low of the next one; it closes when price comes back into it. Liquidity is several swings at one price. A pile of stop orders, and the line runs to the bar that took it. Plus the previous day's high and low as a step line. Every setting is exposed: swing length, break by close or by wick, zone mitigation by close or by wick, joining consecutive gaps, the liquidity range in percent, the previous-extreme period and the trading session.
When to use it. The markup answers what has already happened, not what to do. A demand zone and an unfilled gap are places price returns to more often than to a random point: that is where an entry goes, or a stop gets pulled up. A change of character says the side that used to defend its levels stopped. The script gives no entry and cannot: a swing is declared in hindsight, as many bars later as the swing length says, on the live bar it does not exist yet. That is why the desk rule trading the same ideas is computed separately and only from the past. The chart draws only LIVE zones. The ones price has not returned to yet, and only the freshest (up to 8 gaps, 6 blocks, 6 liquidity levels. The counts the genre standards keep): a mitigated zone has already said its piece, and all of them at once paint the screen over. Mitigated zones come back with the Show mitigated zones setting. The previous period's high and low are drawn only when the period is longer than the chart bar: a 1D setting on daily candles is just the previous candle.
Zero-Lag EMAtrendprice; 20–50 barsHelps you see a trend change earlier.
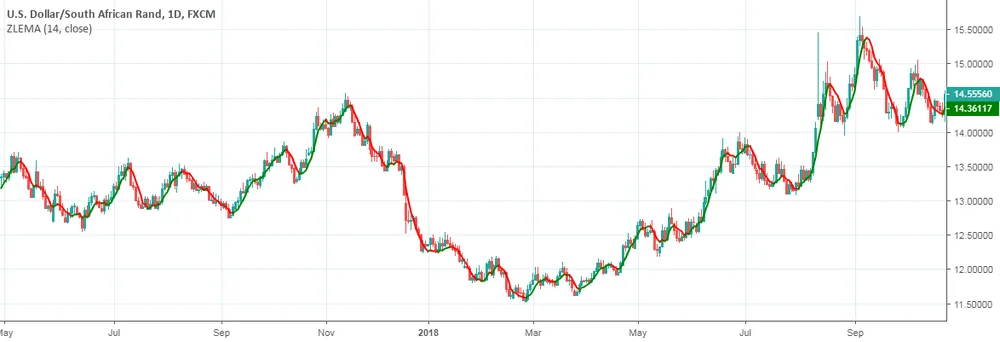
A real TradingView chart, script by everget. How it works. A plain EMA always lags a step behind: a new price enters the average gradually. Zero-Lag EMA first corrects the input itself. It adds the difference between the current close and the close N bars back, and only then smooths that adjusted value with a normal EMA. The line sits almost on top of price and turns 1–3 bars earlier than a classic EMA of the same length.
When to use it. A faster stand-in for EMA/SMA on a trend: price crossing the line, or two Zero-Lag EMAs of different length (say 20 and 50) crossing each other, marks a direction change. On a range it whipsaws more. The same speed that helps on a trend hurts here.
McGinley Dynamic (Improved)trendprice; adaptive periodShows market direction with less lag.
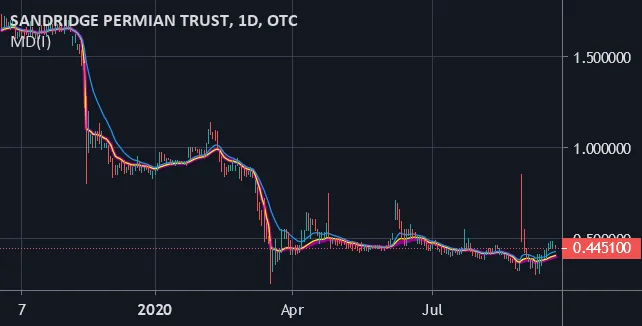
A real TradingView chart, script by ImmortalFreedom. How it works. A moving average with a self-adjusting step: MD = MD[1] + (price - MD[1]) / (k * N * (price/MD[1])^4). The power of 4 widens the step sharply when price pulls away and shrinks it to almost nothing when price sits close. The catalogue version adds a cap on the denominator, without which the line sometimes flew off, and a k of 0.6.
When to use it. A substitute for a plain average where one smoothing speed does not fit the whole chart: on a quiet market the line barely moves, on a fast one it speeds up by itself. Price breaking the line and the line then turning marks the start of a trend.
Kirshenbaum BandsvolatilityEMA + price deviationShows the move expanding and contracting.
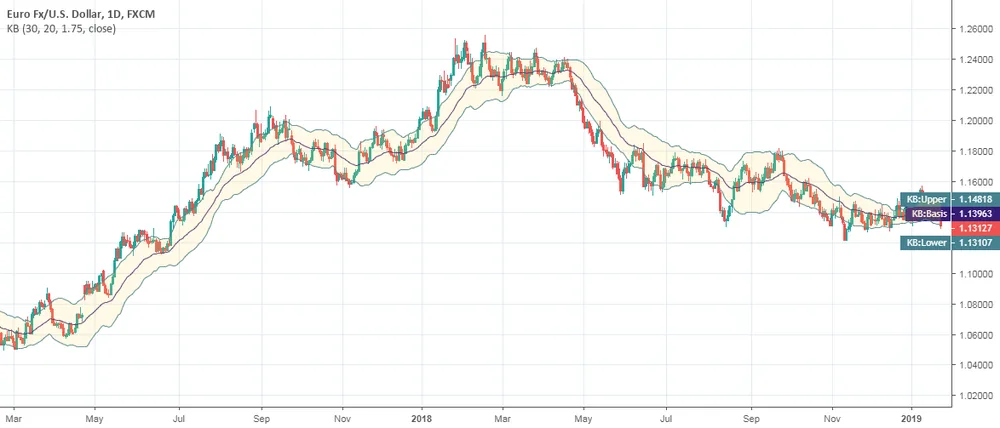
A real TradingView chart, script by everget. How it works. A channel around an EMA, but the band width comes from the standard error of a regression line, not from price's standard deviation like Bollinger Bands. It measures how far price strays from the local trend line, not from a flat average. The bands narrow when the move is smooth and predictable, and widen when price whips around the trend without commitment.
When to use it. Narrowing bands mean the move along the trend is orderly and a position can be held. Widening bands with price breaking out mean the trend is losing control, either a reversal or a sharp acceleration.
Ehlers CyberCyclecycleprice; short cycleHelps find turns inside a range.
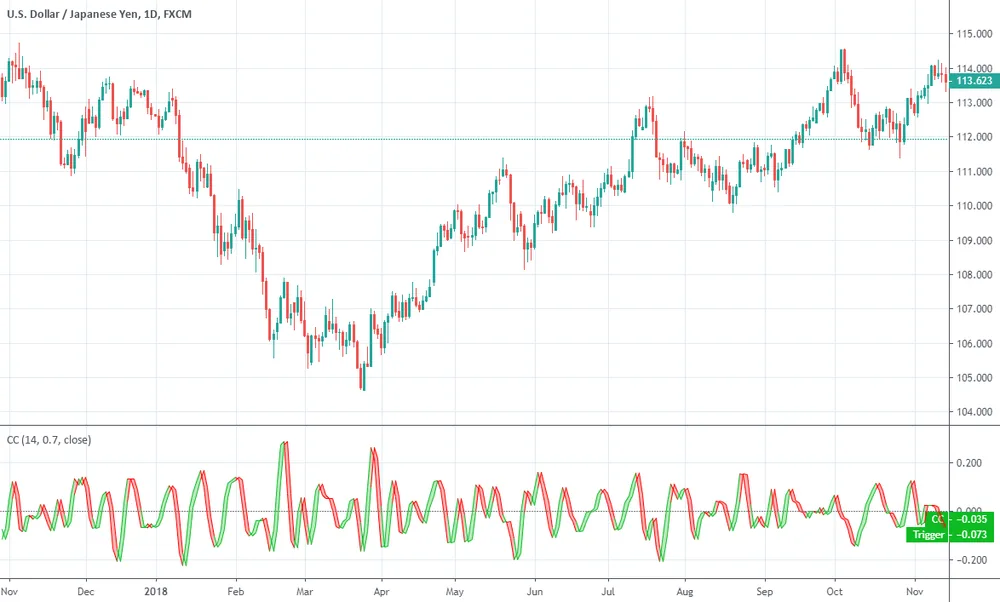
A real TradingView chart, script by everget. How it works. John Ehlers builds it in two steps: price first passes through a simple 4-tap smoothing filter that removes high-frequency noise, then through a high-pass filter that subtracts the slow component (the trend) and keeps only the oscillation. The result is close to a sine wave that tracks the market's rhythm, not its direction.
When to use it. On a range, the highs and lows of CyberCycle line up with price's local turns, entry points against the edges of the range. On a strong trend there is no real cycle to find, and any wave shape here is noise, not trigger.
Multiple Hull Moving Averagetrendprice; 20/50/100 barsShows market direction across several horizons.
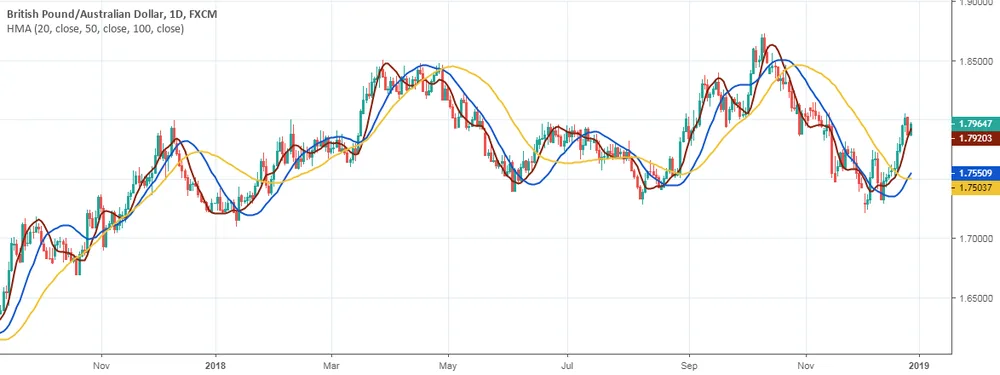
A real TradingView chart, script by everget. How it works. The catalogue script draws THREE Hull lines at once - 20, 50 and 100 bars. Each is built in three steps: two weighted averages, full length and half length; their doubled difference gives an almost lag-free but noisy series, smoothed once more by an average of length square-root-of-period. Almost none of the lag comes back.
When to use it. Three horizons at once: the short line shows the current move, the long one the backdrop. While all three point the same way the move is uniform; slopes disagreeing is the first sign it is running out.
Chandelier ExitexitATR + extremesHelps hold a position and place a trailing stop.
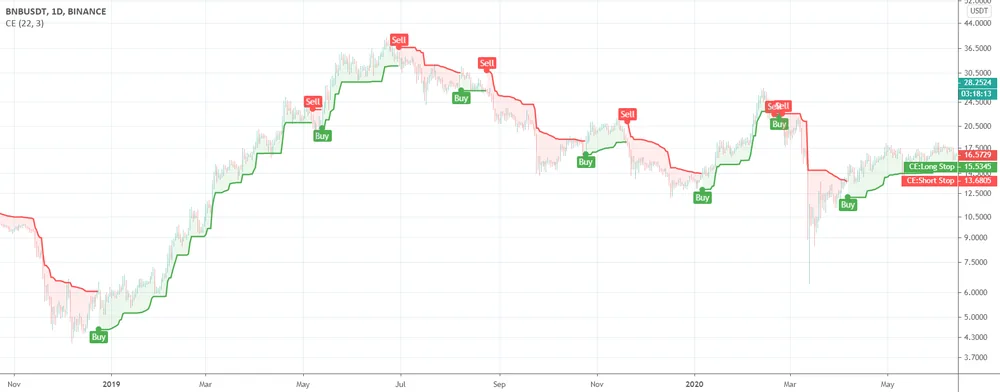
A real TradingView chart, script by everget. How it works. An exit indicator, not an entry one. For a long it takes the highest CLOSE over 22 bars and steps down three ATR from it; the line only moves up and holds still on a pullback. For a short it mirrors. When price closes on the other side the side flips, and the chart marks it by switching lines.
When to use it. A trailing stop on an open position: it holds while the trend lives and takes you out once a pullback reaches the line. Not an entry trigger - management of a position already taken.
Vortex Indicator With Thresholdstrendhigh/low + true rangeShows which side controls the move.
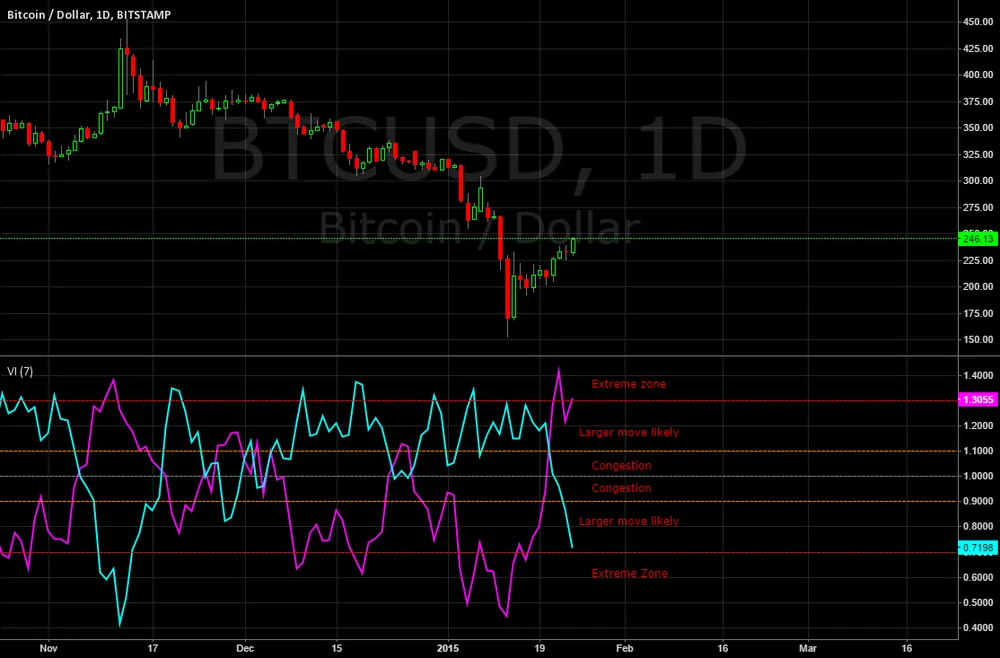
A real TradingView chart, script by Rashad. How it works. Two lines, +VI and -VI: each measures how far a bar's move points up or down relative to yesterday's extreme, divided by the sum of true ranges over the same window. The catalogue script uses a short window - 7 bars - and marks the 0.7, 0.9, 1.1 and 1.3 thresholds on the chart.
When to use it. A cross of +VI and -VI marks a change in who leads the market. The thresholds answer the next question: a line beyond 1.3 or below 0.7 means the move is already strong, not just starting.
Keltner Channels WidthvolatilityKeltner channelShows the market's squeeze and expansion periods.
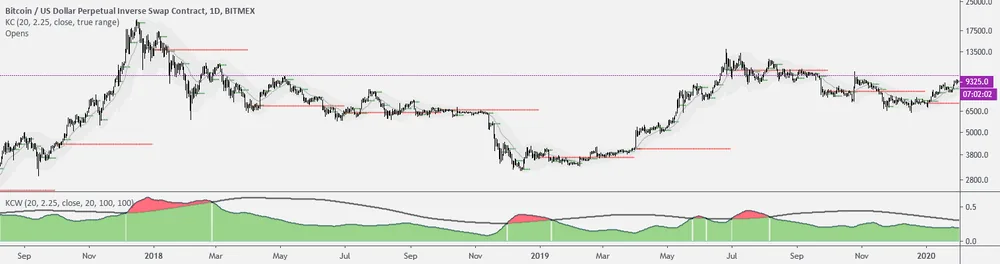
A real TradingView chart, script by shtcoinr. How it works. The catalogue carries not the channel itself but its WIDTH. The channel is built the usual way - a 20-bar average with a 2.25 true-range offset - but one value goes on the chart: the distance between the edges divided by the average, smoothed once more. A line of the widest reading over 100 bars runs alongside.
When to use it. Width at its low means a squeeze: the market is standing still, and moves usually start here. Width at the upper line means the move is already stretched and late to chase. As a number this reads earlier than the channel does by eye.
Ehlers Fisher Transform [CC]momentumprice; 10 barsHelps spot possible reversal points.
![Ehlers Fisher Transform [CC] on a TradingView chart](/assets/indicators/refs/fisher-transform.webp)
A real TradingView chart, script by cheatcountry. How it works. The position of price (the bar's midpoint) inside the last 10 bars' range is mapped into -1 to +1 and smoothed: one third of the new value, two thirds of the old. The inverse hyperbolic tangent is applied to the result and it too is halved with its previous value. The function stretches the edges sharply, so peaks come out crisp.
When to use it. A sharp peak with the line turning down (or a trough with it turning up) marks a reversal, usually a bar or two ahead of price. The second line is the same series shifted by one bar, and their cross is the turn itself.
New Choppiness Indexregimetrue range; 55 barsShows a trending market versus a range.
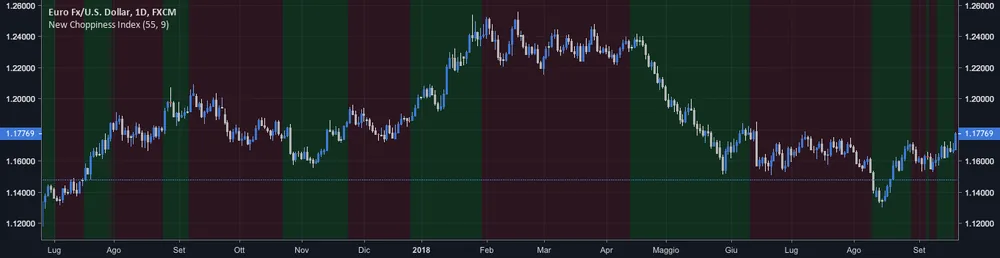
A real TradingView chart, script by vitelot. How it works. The catalogue script draws no line - it paints the BACKGROUND. The sum of true ranges over 55 bars is divided by the window's overall span and by the square root of its length. A lot of back-and-forth inside a narrow corridor gives a large value; a one-way move gives a small one. The same value smoothed over 9 bars runs alongside, and the background colour depends on which of the two is higher.
When to use it. A green background means the market is running one way and trend rules work as designed. Red means it is churning in place, where breakouts throw off many false triggers. It is a switch for other rules, not a trigger on its own.
Supertrendtrend / exitATR + priceShows trend direction and possible exit levels.
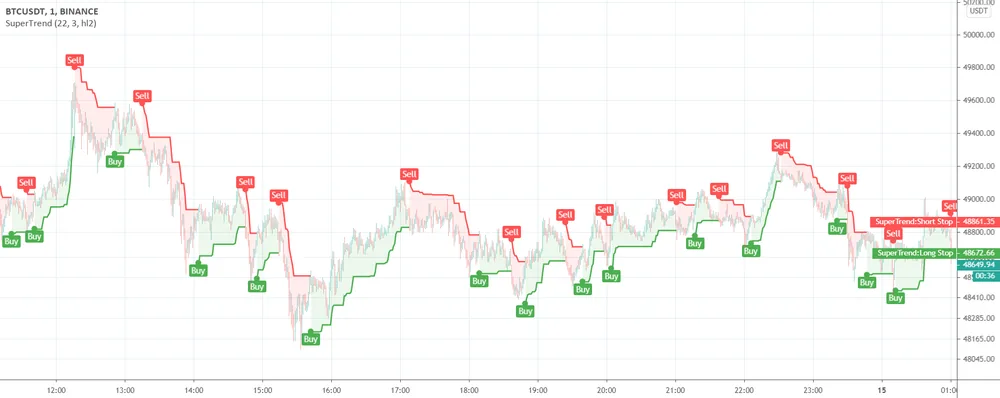
A real TradingView chart, script by everget. How it works. The line is built from the median price (high+low)/2, offset by K×ATR to the side opposite the current trend. While price is above the line, the line only ratchets upward with it (a trailing stop for a long); while price is below, it only ratchets down. The moment price closes on the other side, direction flips and the line rebuilds from the new side.
When to use it. Both a trend filter (which side the line sits on shows the current direction) and a trailing exit. The line flipping sides is either a trend-following entry or an exit from the prior position, depending on whether the system trades the flip or holds through it.
 DropsTab
 Blockchair
 CoinGecko
 Alchemy
 TradingView